What is the format of infographic?
When creating an infographic in A4 size, it’s important to consider the amount of information and visual elements you want to include, as A4 has limited space compared to larger formats. You may need to carefully choose the fonts, graphics, and data visualizations to ensure they are clear and legible at a smaller size. It’s also important to consider the layout and organization of the infographic to make sure it flows well and effectively communicates the intended message.
Infographic dimensions in A4 size can be a great option for creating printable handouts, posters, or digital assets that can be easily shared or distributed. Just make sure to optimize the design and content for the smaller format to ensure that the infographic remains visually appealing and effective in conveying information.
How big is an infographic on Canva?
 Canva, which is a popular online graphic design tool, offers a variety of templates for creating infographics, and the size of an infographic on Canva can vary depending on the template you choose or if you create a custom size.
Typically, Canva provides a wide range of pre-set sizes for infographics, which can include:
- Standard Social Media Sizes: These may include sizes like 800 x 2000 pixels, 1080 x 1080 pixels, or other dimensions that are optimized for sharing on social media platforms like Instagram, Facebook, or Twitter.
- Presentation Sizes: These may include sizes like 1920 x 1080 pixels or other dimensions that are suitable for creating infographics to be used in presentations or slideshows.
- Print Sizes: These may include sizes like 8.5 x 11 inches, 11 x 17 inches, or other dimensions that are intended for printing infographics as handouts, posters, or other physical materials.
- Custom Sizes: Canva also allows you to create custom-sized infographics by specifying your own dimensions in pixels or inches, giving you flexibility in designing an infographic that fits your specific needs.
It’s important to note that Canva’s features and specifications may change over time, so it’s always best to check the latest information on Canva’s website or within the Canva application to confirm the available sizes for infographics.
What are the 5 types of infographics?
 Infographics are visual representations of information or data that aim to present complex information in a clear and concise manner. There are several types of infographics, each with its own unique purpose and design. The five common types of infographics are:
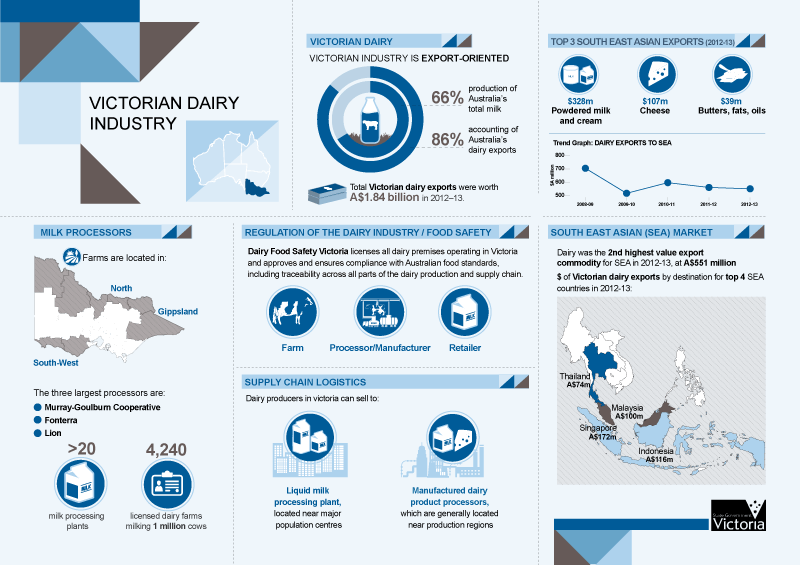
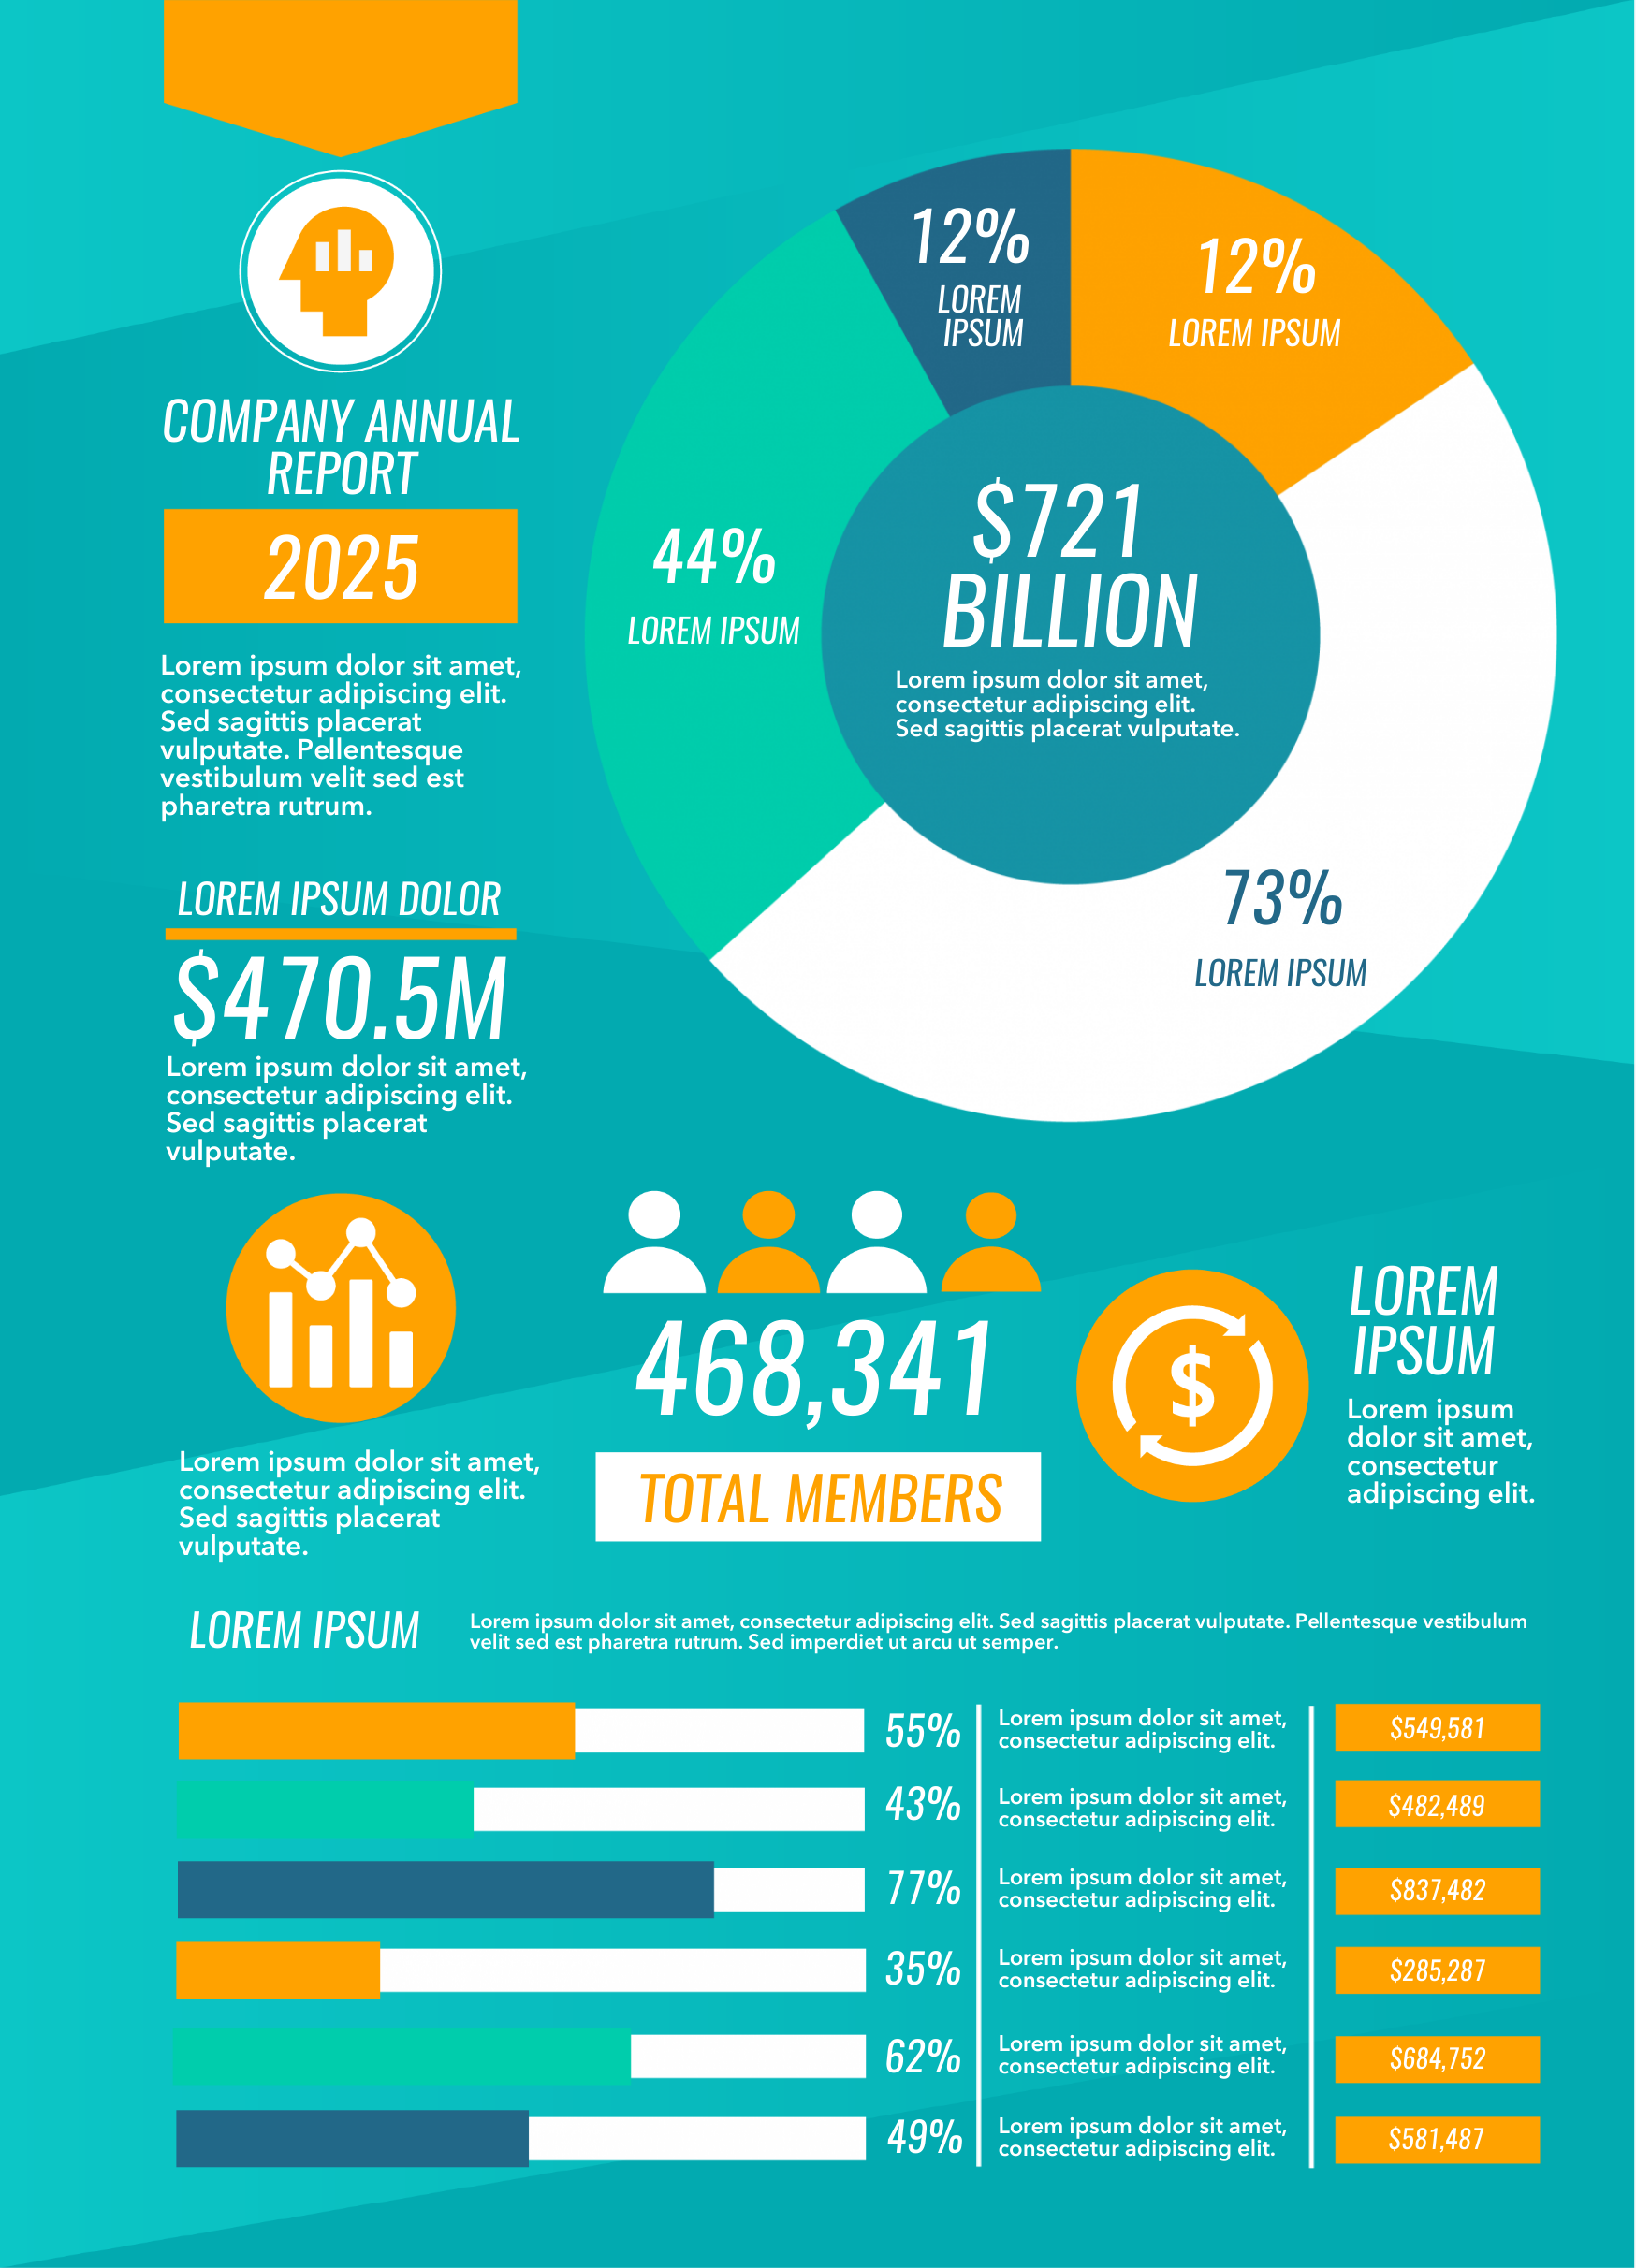
- Statistical Infographics: These infographics use charts, graphs, and other visual elements to represent data and statistics. They are commonly used to display numerical information, such as sales figures, survey results, or demographic data.
- Informational Infographics: These infographics focus on presenting information or explaining a concept in a visual and easily understandable way. They may use icons, illustrations, or diagrams to convey information on a specific topic, such as how-to guides, process explanations, or timelines.
- Comparison Infographics: These infographics are used to compare and contrast different data sets, items, or concepts. They often use side-by-side comparisons, Venn diagrams, or other visual techniques to highlight similarities and differences between two or more subjects.
- Timeline Infographics: These infographics present information in a chronological order, using a timeline format. They are commonly used to illustrate historical events, project timelines, or the progression of a process over time.
- Geographic Infographics: These infographics use maps or other geographic representations to convey information related to a specific location or region. They are often used to show demographic data, population density, or other location-based information.
These are just some of the many types of infographics that can be used to visually communicate information effectively. The choice of infographic type depends on the data or information being presented and the intended audience.
What page size are infographics?
 Infographics can come in various sizes depending on the intended use and distribution method. Common page sizes for infographics are:
- Letter size: 8.5 inches by 11 inches (21.6 cm by 27.9 cm) – This is a standard page size in the United States and is often used for printed materials such as handouts, reports, or presentations.
- A4 size: 8.27 inches by 11.69 inches (21 cm by 29.7 cm) – This is a standard page size in most countries outside of the United States and is commonly used for printed materials such as brochures, posters, or presentations.
- Poster size: 18 inches by 24 inches (45.7 cm by 61 cm) or larger – This is a larger size that is often used for infographics that are intended to be displayed as posters in public spaces or at events.
It’s important to note that infographics are not limited to these specific page sizes and can be created in custom sizes depending on the design and purpose. When creating infographics, it’s essential to consider the intended use, distribution method, and design principles to ensure that the infographic is visually appealing and effectively communicates the intended message.
What is the best format for an infographic?
 The best format for an infographic depends on various factors, including the purpose, content, and audience of the infographic, as well as the platform on which it will be published. Here are some common formats for infographics:
- Static Image: A static image is a common format for infographics, typically in JPEG or PNG format. It can be easily shared via email, social media, or embedded in a webpage. Static images can be designed with a fixed size and aspect ratio, making them suitable for print or online use.
- Interactive HTML: An interactive HTML infographic is a dynamic format that allows users to interact with the content, such as clicking on buttons, scrolling, or zooming in and out. It is typically created using HTML, CSS, and JavaScript, and can be hosted on a website or shared via a link. Interactive HTML infographics can be engaging and provide a more immersive experience for users.
- Animated GIF: An animated GIF is a simple animation format that can be used to create short, looping animations. It can be effective for conveying simple concepts or demonstrating a process or workflow. Animated GIFs are typically smaller in file size compared to other formats, making them suitable for sharing on social media or embedding in websites.
- Video: A video infographic is a dynamic format that combines visuals, text, and narration to tell a story or explain a complex concept. Videos can be uploaded to video sharing platforms like YouTube or Vimeo, or embedded in websites or presentations. Video infographics are effective for engaging audiences who prefer visual and auditory learning.
- Interactive PDF: An interactive PDF is a format that combines static images with interactive elements, such as hyperlinks, buttons, and forms. It can be viewed and interacted with using PDF readers, which are widely available on most devices. Interactive PDFs are useful for sharing infographics as downloadable files or for printing as handouts.
The best format for an infographic depends on the specific requirements of your project and the preferences of your target audience. Consider the content, purpose, and distribution platform of your infographic, and choose a format that will effectively convey your message and engage your audience.
What size should an infographic be?
 The size of an infographic can vary depending on its intended use and distribution platform. However, there are some common recommendations for infographic sizes that can serve as general guidelines:
- Width: For online use, the width of an infographic is typically recommended to be between 600 and 1200 pixels. This ensures that it fits well within the content area of most websites, blogs, and social media platforms without requiring horizontal scrolling.
- Height: The height of an infographic can vary depending on its content and design. It should be long enough to accommodate the information being presented, but not so long that it becomes unwieldy or requires excessive scrolling. A common range for infographic height is between 800 and 2000 pixels, although taller infographics may be appropriate for certain types of content.
- File Size: Infographic file size should be optimized for online use to ensure fast loading times. As a general rule of thumb, the file size should be kept below 1-2 MB to prevent slow loading and performance issues.
It’s important to note that different platforms and mediums may have specific size requirements, so it’s always a good idea to check the guidelines of the platform where you plan to share or publish your infographic to ensure it meets their specifications.
Additionally, if you plan to print the infographic for physical distribution, the size and resolution will depend on the intended print size and quality. Higher resolutions (300 dpi or higher) are typically required for print to ensure crisp and clear images, while the physical dimensions will depend on the desired print size. Be sure to check with your printer for their specific requirements.
How Long Should Infographic Be: FAQs
Q: Is there a universal length for infographics? Crafting infographics involves considering various factors, making a universal length challenging to define. However, staying within the 800 to 1000 pixels range is generally recommended.
Q: Can longer infographics be effective in certain scenarios? While concise infographics are the norm, longer versions can be effective for in-depth explanations or storytelling. Just ensure the content justifies the length.
Q: Are there specific dimensions for social media infographics? Yes, optimal dimensions vary for each platform. For instance, Instagram favors a vertical layout, while Twitter thrives on horizontal designs.
Q: How frequently should infographics be updated? Regular updates keep your content relevant. Aim for updates every 6 to 12 months, or sooner if there are significant changes in your industry.
Q: Should infographics be text-heavy or image-heavy? A harmonious blend works best. Too much text overwhelms, while too many images may confuse. Strive for a balanced mix for optimal engagement.
Q: Are there tools to help determine the ideal infographic length? Yes, several online tools assist in determining the ideal length based on your content. Experiment with these tools to find what works best for your audience.
Conclusion
Crafting the perfect infographic involves understanding your audience, platform requirements, and the delicate balance between content and visuals. As you embark on your infographic journey, keep experimenting, testing, and refining. Remember, the ideal length is a dynamic concept that may evolve with your audience’s preferences and industry trends.