From the perspective of someone who isn’t a designer, creating an infographic that’s both beautiful and effective can seem like an impossible task…but that’s far from the truth. Follow our beginner-friendly infographic design guide below to learn how to make your own.
How to Make an Infographic:
Let’s dive into each step in more detail.
Outline your goals for creating your infographic
Create infographics is a visual communication aid that you can use to:
Provide a quick overview of a topic
Whether you’re presenting a new concept that is difficult to understand, outlining the steps in a project plan, or introducing a new policy, summarizing the information with an infographic can clear up confusion. Your colleagues will be forever grateful:

Explain and simplify a complex process
New processes can cause a lot of confusion. If it’s a complex process that might be hard for people to wrap their heads around, try creating a process infographic that your audience or clients can use as a reference:

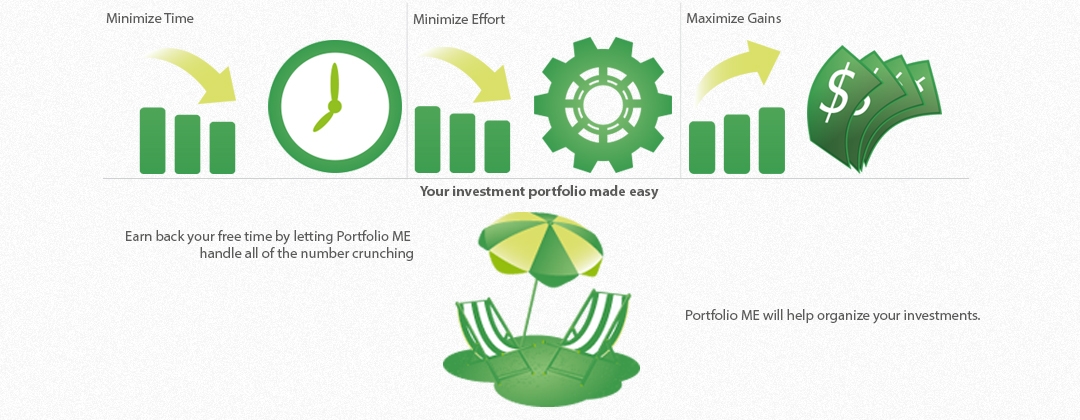
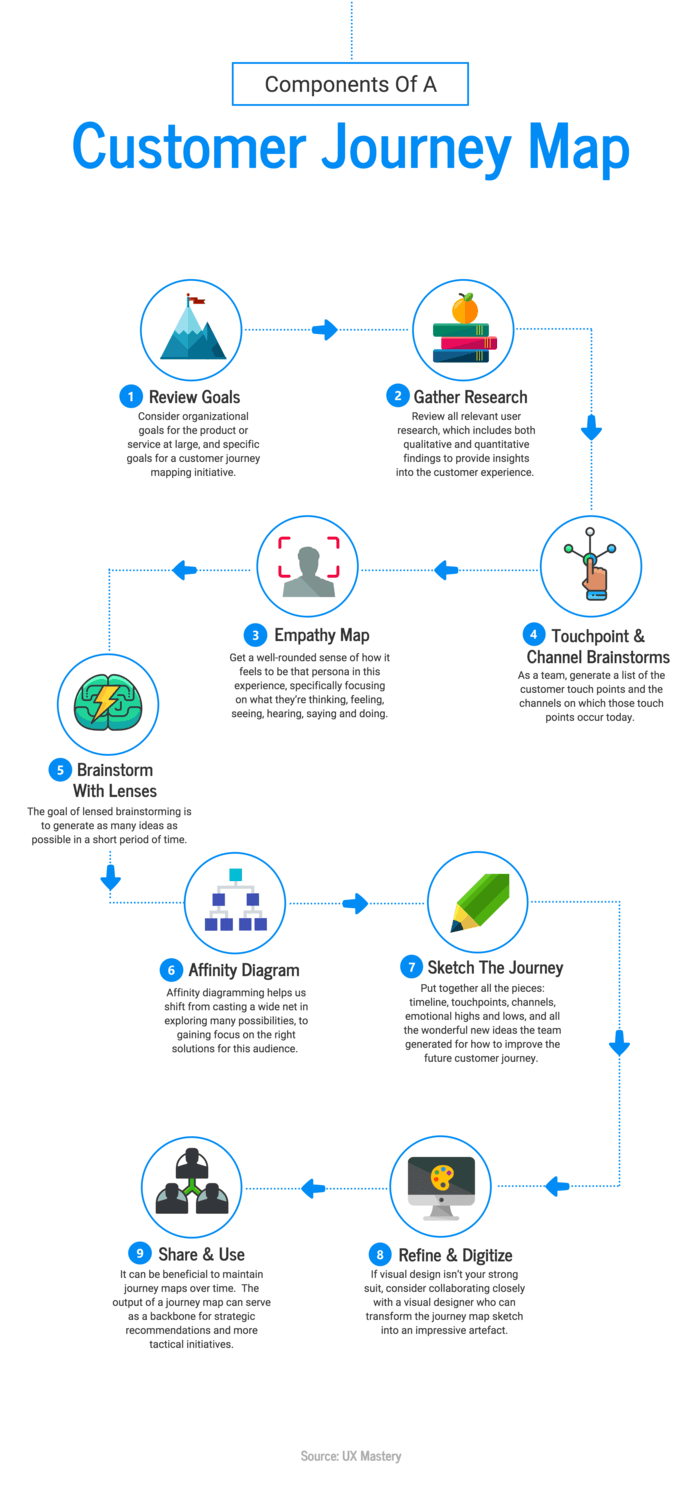
Process infographics design can be helpful for demystifying abstract processes like a customer journey:
Display research findings or survey data
Infographics are the perfect way to share survey data because they allow you to tell a story with your data. This comes in particularly handy if you’re sharing your survey data on social media, in a blog post, or an a white paper. Infographics create the potential to get a lot of eyes on your survey data. Take this content marketing statistics infographic, for example:

Summarize a long blog post or report
When you have a long blog post or report, it can be helpful to summarize key points in an infographic. This makes it easy for readers to scan for the most important information.
Instead of having to answer the same questions after sending out a report, or having people miss out on important details–a summarized visual report helps to eliminate these issues:

Compare and contrast multiple options
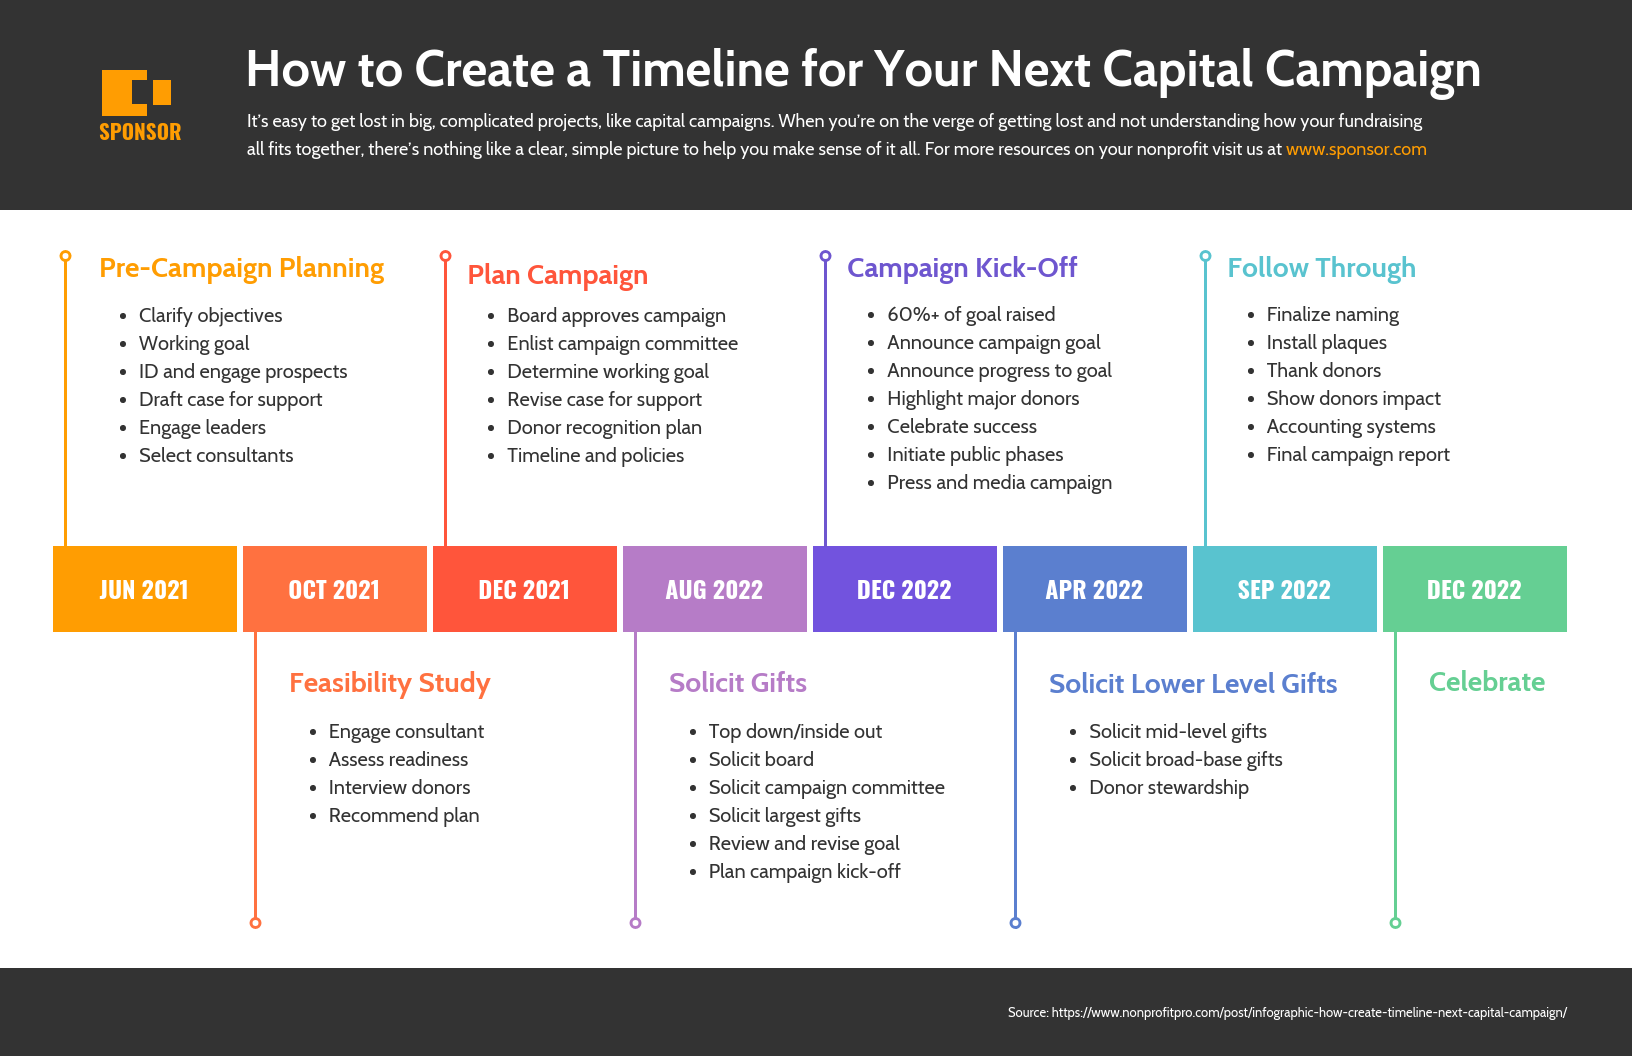
When presented with two good options, how do you make a decision? Write down the pros and cons of each. A comparison infographic is a visual way to compare product, plans, arguments, and ideas:

Raise awareness about an issue or cause
Using your social channels to build awareness is important for many organizations. Infographics have the power to help you tell a story with data–to put a face to numbers.

Before you begin to think about layout design, charts, or aesthetics, you need to think hard about the goals of your infographic. Why are you making this infographic?
When I say goals, I don’t mean high-level goals like “summarize complex information” or “improve website traffic”.
I mean clear, concrete, achievable communication goals.
Define the burning problem
Recognize that you’re creating this infographic so that your audience can gain something very specific from reading it. That very specific thing should be a burning problem that your audience has in their lives, and that your infographic is going to solve.
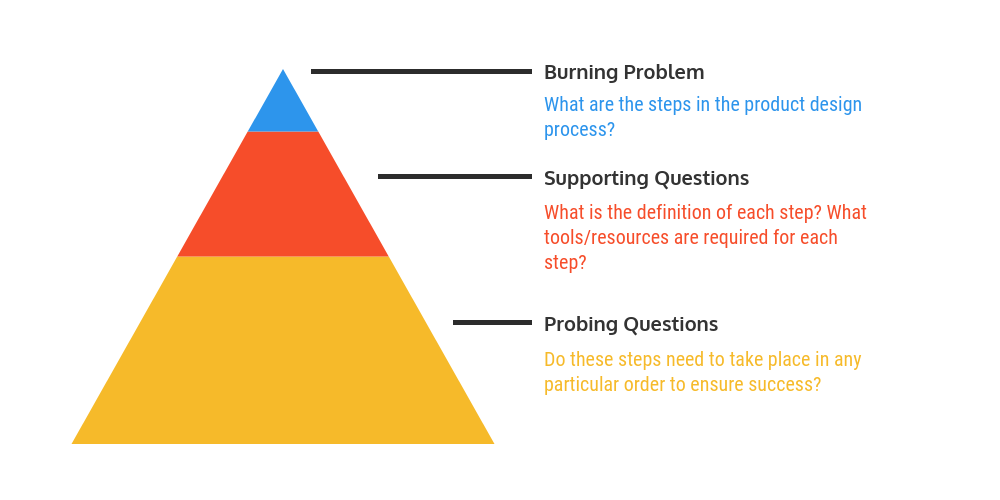
Use a question pyramid
From there, use a question pyramid to take that burning problem and turn it into 3-5 actionable questions to tackle in your infographic: 
These questions will become the framework around which you’ll build your infographic, and will help you tell a compelling story.
The supporting questions should reveal the basic information your audience will need to know to understand the main topic, and the probing questions that will reveal broader insights which should ultimately solve the burning problem.
Let’s work through an example. This infographic outlines the steps in the product design process:
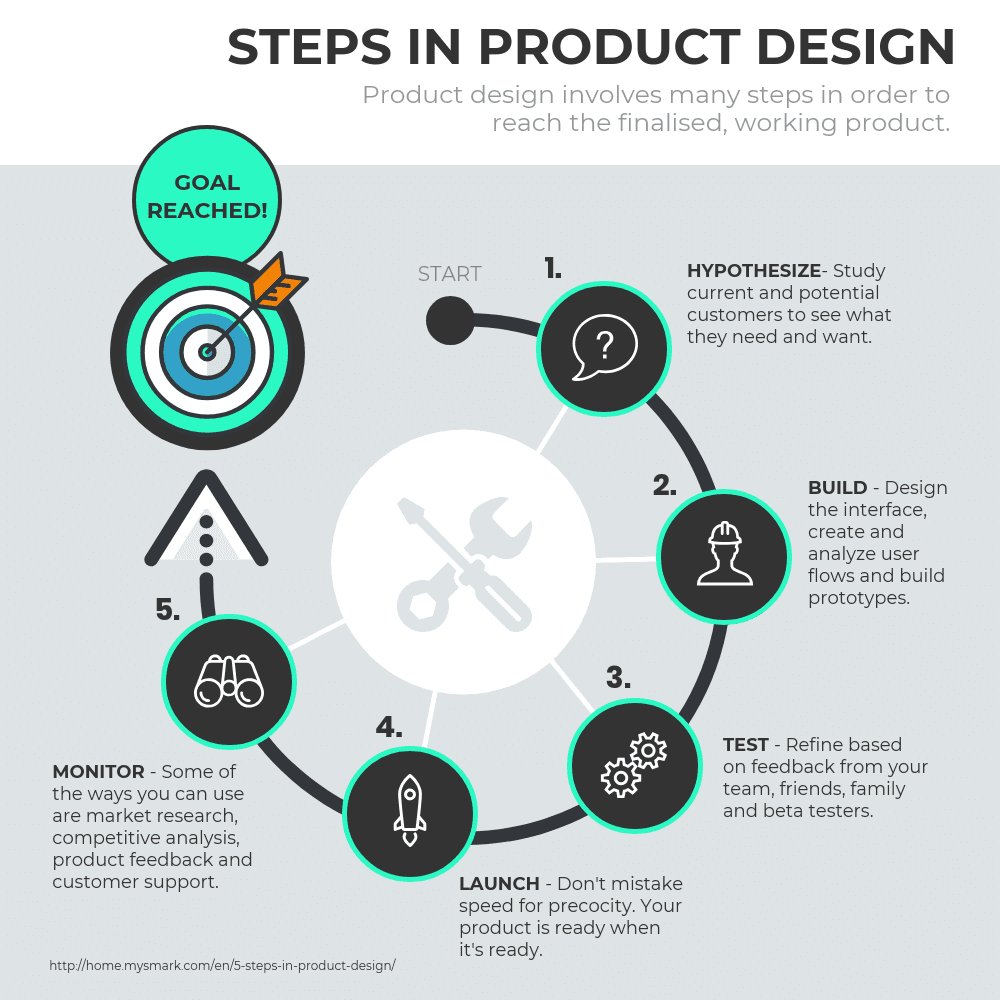
The burning problem they’re trying to solve is “what steps are in the product design process?” Their question pyramid might look something like this:
 Defining the burning problem and using the question pyramid to break it down into actionable questions is the first step to making an effective infographic.
In a digital age where attention spans are fleeting, creating infographics has become a powerful tool for conveying information. This article is your ultimate guide to mastering the art of crafting engaging and informative visuals. From design principles to software recommendations, we’ve got you covered.
Understanding the Essence of Creating Infographics
Delve into the core of creating infographics. Uncover the psychology behind visual information and discover why infographics have become indispensable in content creation. Learn how to make your message resonate with your audience visually.
Crafting Compelling Visual Narratives
Explore the nuances of storytelling through infographics. From choosing the right color palette to structuring your narrative, we’ll guide you through creating a visual story that captivates your audience and communicates your message effectively.
The Role of Typography in Infographic Design
Typography can make or break an infographic. Understand the impact of font selection, size, and spacing. Discover the art of balancing text and visuals for an infographic that is not just visually appealing but also easy to read.
Choosing the Right Infographic Style
Unleash your creativity by exploring various infographic styles. Whether it’s a flowchart, timeline, or comparison infographic, each style has its unique advantages. Find the perfect match for your content and elevate its impact.
Tools of the Trade: Infographic Design Software
Navigate through the myriad of infographic design tools available. From user-friendly platforms for beginners to advanced software for seasoned designers, we’ll help you find the perfect tool to bring your infographic ideas to life.
Creating Infographics: Step-by-Step Guide
Embark on a step-by-step journey into the actual process of creating infographics. From conceptualization to finalization, follow our detailed guide, ensuring you create visually stunning and information-rich graphics.
Common Mistakes to Avoid in Infographic Design
Learn from the pitfalls others have faced. We highlight common mistakes in infographic design and provide insightful tips on how to sidestep them. Enhance your skills by learning from the errors of the past.
The Impact of Infographics on SEO
Discover how infographics can boost your website’s SEO. Uncover the connection between visual content and search engine rankings. Maximize the potential of your infographics to enhance your online visibility.
Promoting Your Infographics Effectively
Creating an infographic is just the first step. Learn the strategies to effectively promote your visuals across various platforms. From social media to email campaigns, master the art of getting your infographics noticed.
Creating Infographics: A Closer Look
Unravel the intricacies of creating infographics. Dive into the detailed process, understanding every aspect from conception to execution. Learn how to make your visuals not just visually appealing but also information-packed.
Frequently Asked Questions (FAQs)
Q: Can I create infographics without any design experience? Absolutely! With user-friendly infographic tools available, anyone can create stunning visuals, regardless of design experience.
Q: What makes a successful infographic? A successful infographic combines compelling visuals, concise information, and a clear narrative. It should be visually appealing while effectively conveying the intended message.
Q: Are there free infographic design tools? Yes, many free tools like Canva and Piktochart offer a range of features for creating infographics without a hefty price tag.
Q: How can infographics enhance my content marketing strategy? Infographics make information digestible and shareable, enhancing your content’s reach and engagement.
Q: Can I use infographics for business presentations? Certainly! Infographics can be a powerful addition to business presentations, making complex data more accessible and engaging.
Q: Are there any copyright concerns when using infographic templates? Always check the licensing agreements of the templates you use. Many platforms offer templates with licenses that allow commercial use.
Conclusion
Mastering the art of creating infographics opens a world of possibilities for effective communication. From conveying complex data to enhancing your content’s visual appeal, infographics are a versatile tool. Dive into this creative process, and let your visuals speak volumes.
Do you want to built an infograph graphic design?