Infographs are visual representations of information, data, or knowledge that are designed to be easy to understand and digest. They typically combine data, text, and graphics to present information in a clear and engaging way. Infographics can be used for a variety of purposes, including:
- Data visualization: infographs can help you visualize complex data sets, making it easier to understand patterns and trends.
- Education: Infographics can be used to simplify complex concepts and make them more accessible to students.
- Marketing: Infographics can be used to convey marketing messages in a way that is engaging and memorable.
- Social media: Infographics are often shared on social media platforms because they are visually appealing and easy to consume.
Infographic template can take many forms, including charts, graphs, diagrams, timelines, and maps. They can be created using a variety of software tools, including Adobe Illustrator, Canva, and Piktochart. When designing an infographic, it is important to keep the target audience in mind and to use visuals and text that are easy to understand and memorable.
Which infographics to use
 Choosing the right type of infographic templates depends on the data you want to present and the story you want to tell. Here are some common types of infographics and when to use them:
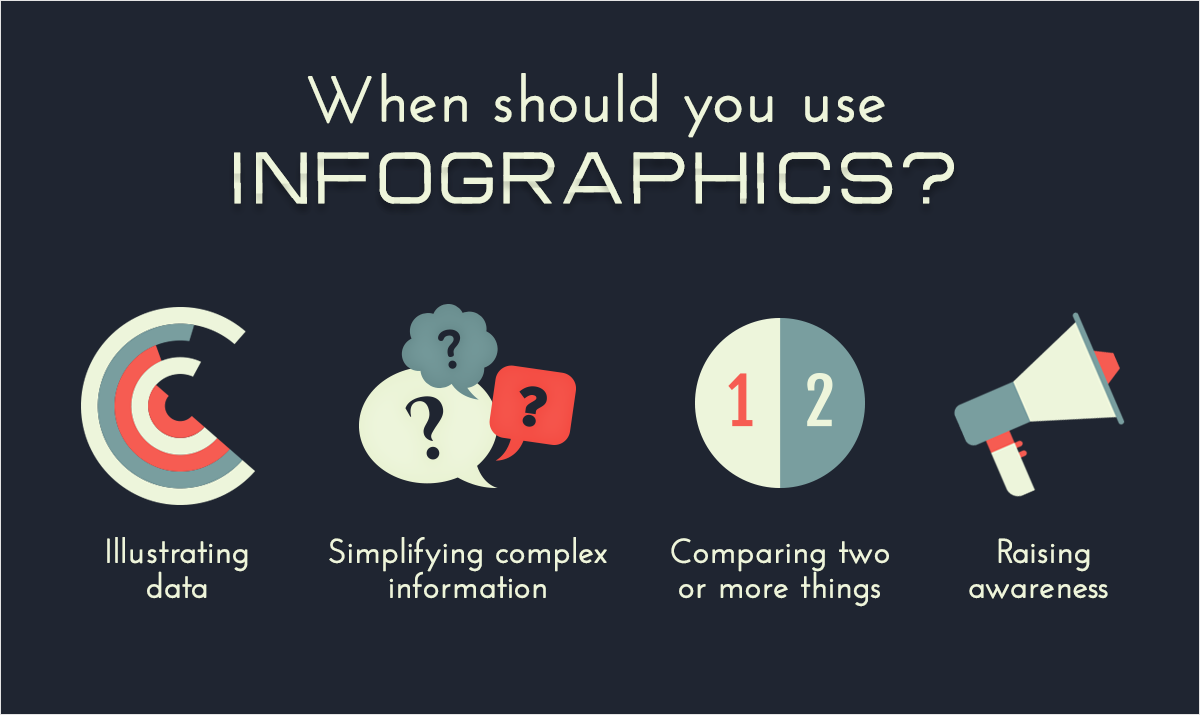
- Informational infographic: Use this type of infographic to present facts, statistics, and other information. It is best for communicating complex data in an easy-to-understand way.
- Timeline infographic: Use this type of infographic to show the sequence of events over time. It is best for presenting historical information or for telling a chronological story.
- Comparison infographic: Use this type of infographic to compare two or more things. It is best for showing the differences between products, services, or ideas.
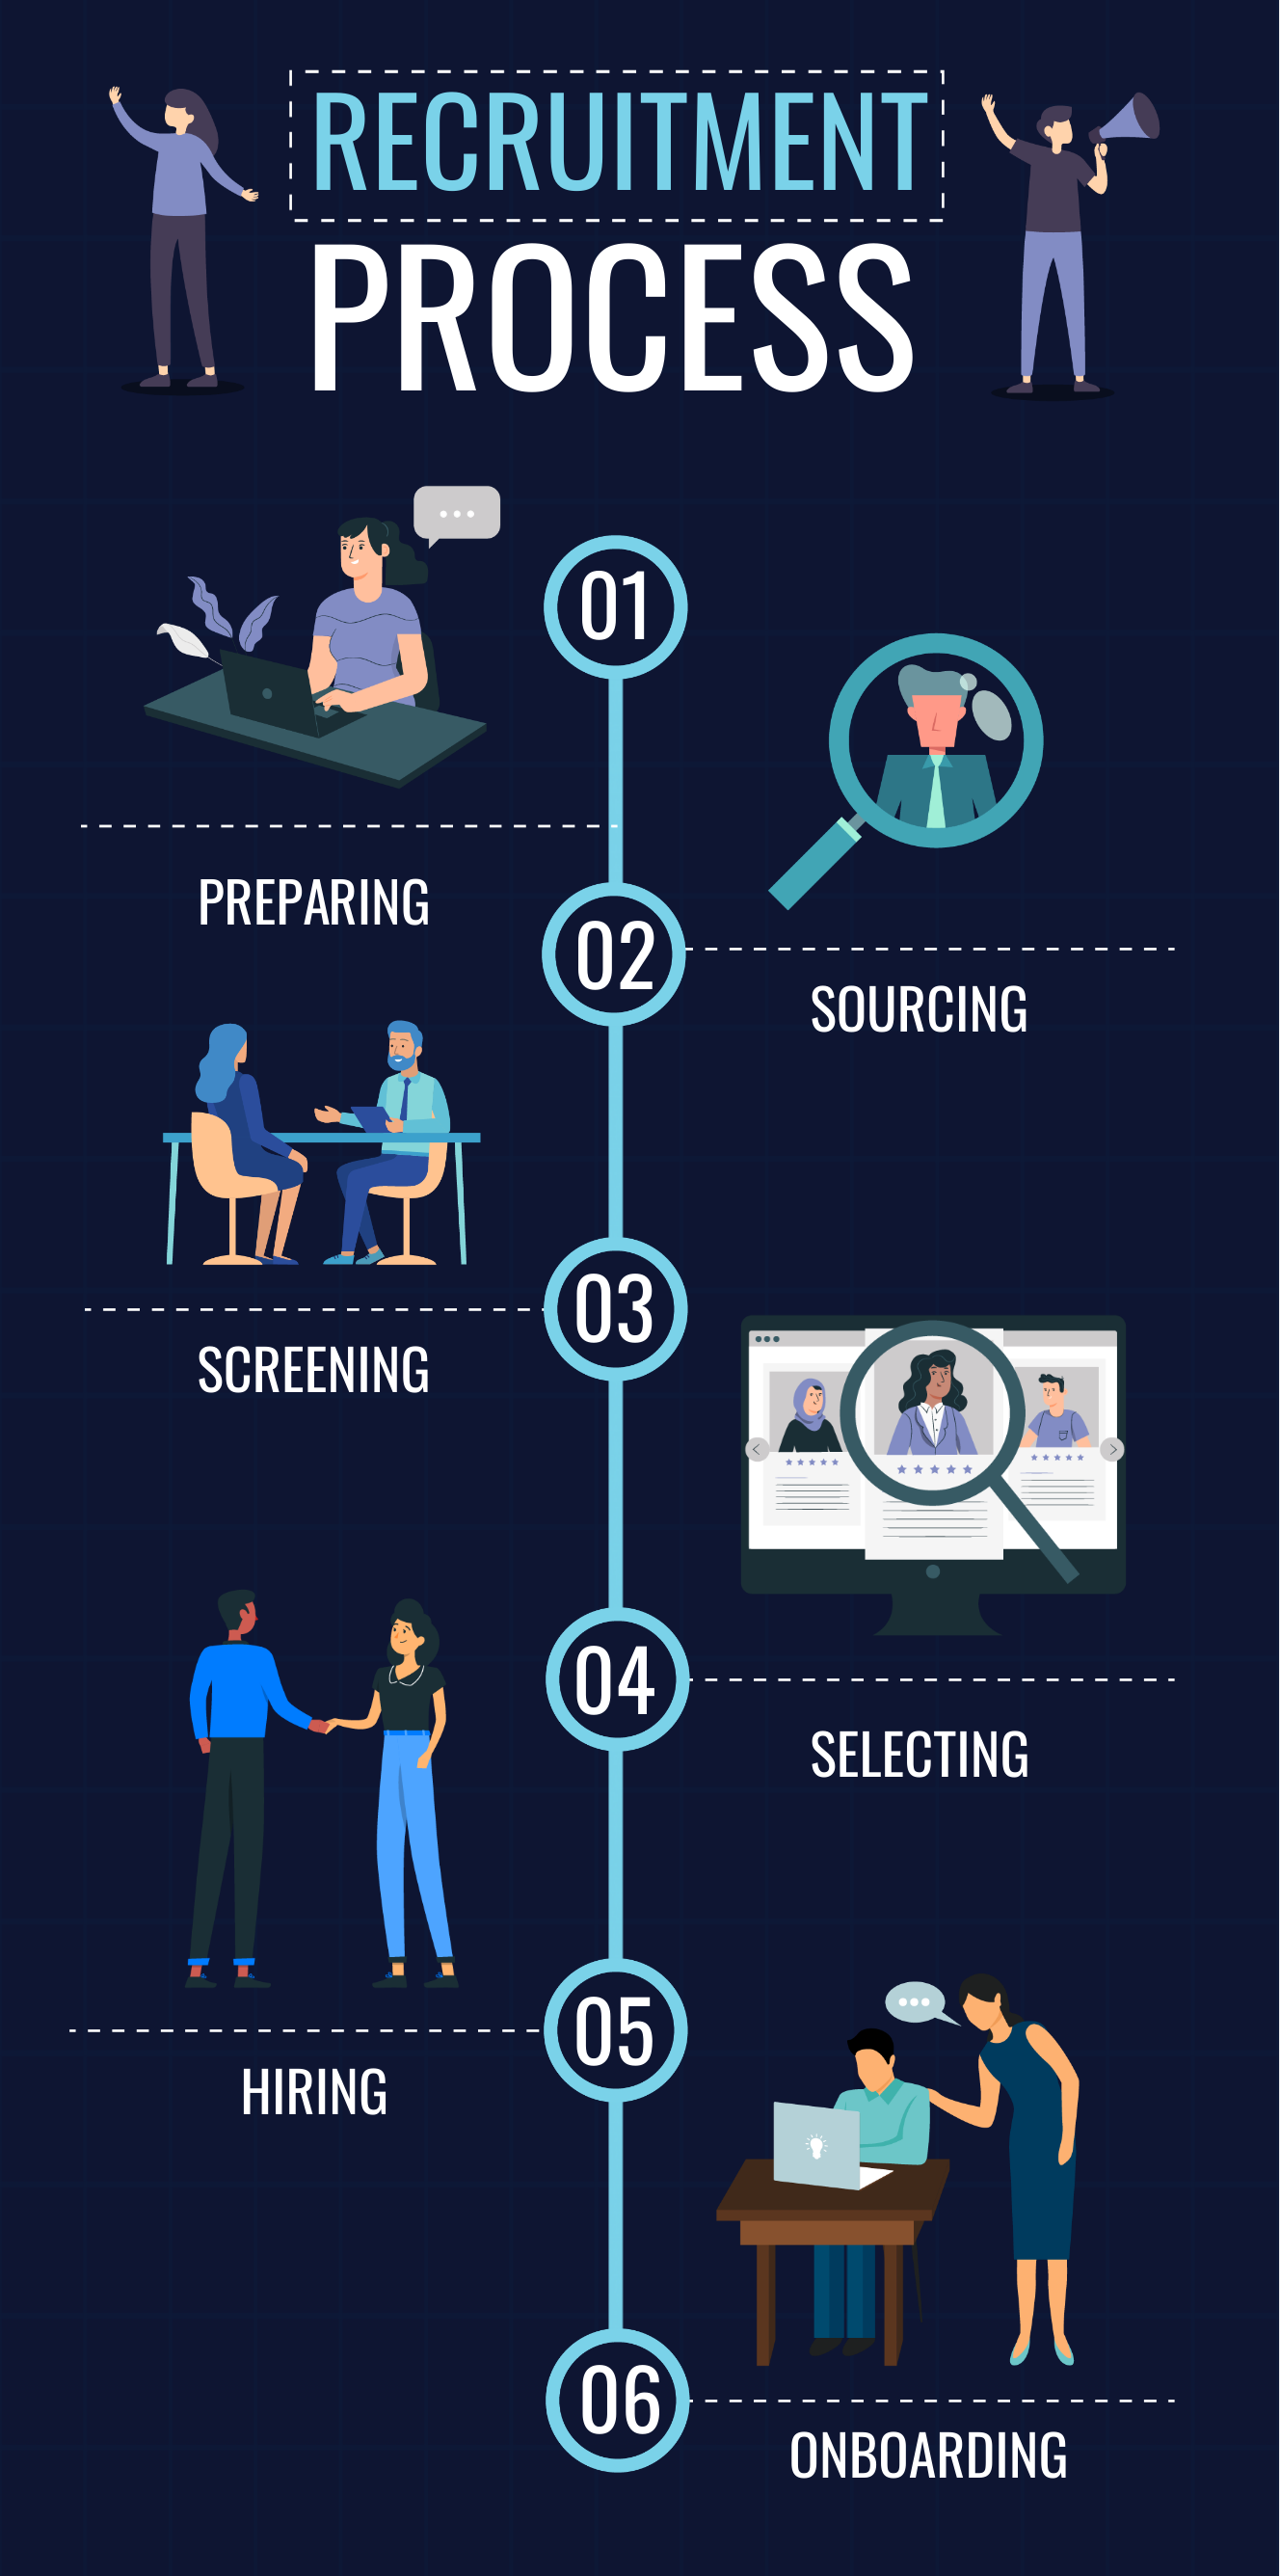
- Process infographic: Use this type of infographic to explain a step-by-step process. It is best for showing how something is done or how a product or service works.
- Geographical infographic: Use this type of infographic to show data related to specific locations. It is best for presenting information about demographics, weather patterns, or other geographic data.
- Hierarchical infographic: Use this type of infographic to show a hierarchy or organizational structure. It is best for presenting information about the levels of an organization or the relationships between different elements.
Ultimately, the type of infographic you choose will depend on your specific data and the message you want to convey.
Where infographics are used
 Infographics are visual representations of information, data, or knowledge intended to convey complex information quickly and clearly. They are used in a variety of settings, including:
- Marketing and Advertising: Infographics are a popular tool for creating compelling marketing and advertising content that engages and informs audiences. Companies use infographics to explain complex concepts, showcase product features, or demonstrate the value of their services.
- Education: Infographics can be used to simplify complex topics and make learning more engaging and fun. Teachers use infographics to present information in a visually appealing way, and students can create their own infographics to demonstrate their understanding of a topic.
- Journalism and Media: Infographics are used to present data and information in news articles, magazines, and other media. They are particularly useful for explaining complex topics, presenting statistics, or showing the relationships between different pieces of data.
- Research and Analysis: Infographics can be used to present research findings and analysis in a clear and concise way. They are commonly used in scientific papers, reports, and presentations to communicate complex data and results.
- Social Media: Infographics are highly shareable and can be used to increase engagement on social media platforms. They are particularly popular on Instagram, Pinterest, and Twitter, where they can be used to convey information quickly and effectively.
Overall, infographics are a versatile tool that can be used in a wide range of settings to simplify complex information, engage audiences, and make data more accessible and understandable.
 What’s infographic design
xInfographic design is the art and science of creating visually appealing graphics that present complex information in a clear and concise manner. Infographics are a powerful tool for communicating data, statistics, and other information in a way that is easy to understand and digest.
Infographic design involves selecting the appropriate data to include, organizing that data in a logical manner, and presenting it in a visually engaging way. This typically involves the use of graphics, icons, and other visual elements to help illustrate key points.
Effective infographic design requires a good understanding of graphic design principles, as well as an understanding of the data being presented. A well-designed infographic should be visually appealing, easy to read and understand, and should communicate the intended message clearly and effectively.
 What infographic shows
Infographics are visual representations of information, data, or knowledge designed to present complex information quickly and clearly. They use a combination of images, charts, graphs, and text to communicate information in a way that is easy to understand and remember.
Infographics can be used to:
- Present statistical data or research findings in a clear and concise manner.
- Explain complex ideas or concepts in an easy-to-understand way.
- Showcase product features or benefits in a visually appealing way.
- Compare and contrast different options or solutions.
- Tell a story or convey a narrative in a compelling way.
Overall, infographics are a powerful tool for communicating information visually and can be used in a variety of contexts, from marketing and advertising to education and journalism.
Why infographics are important
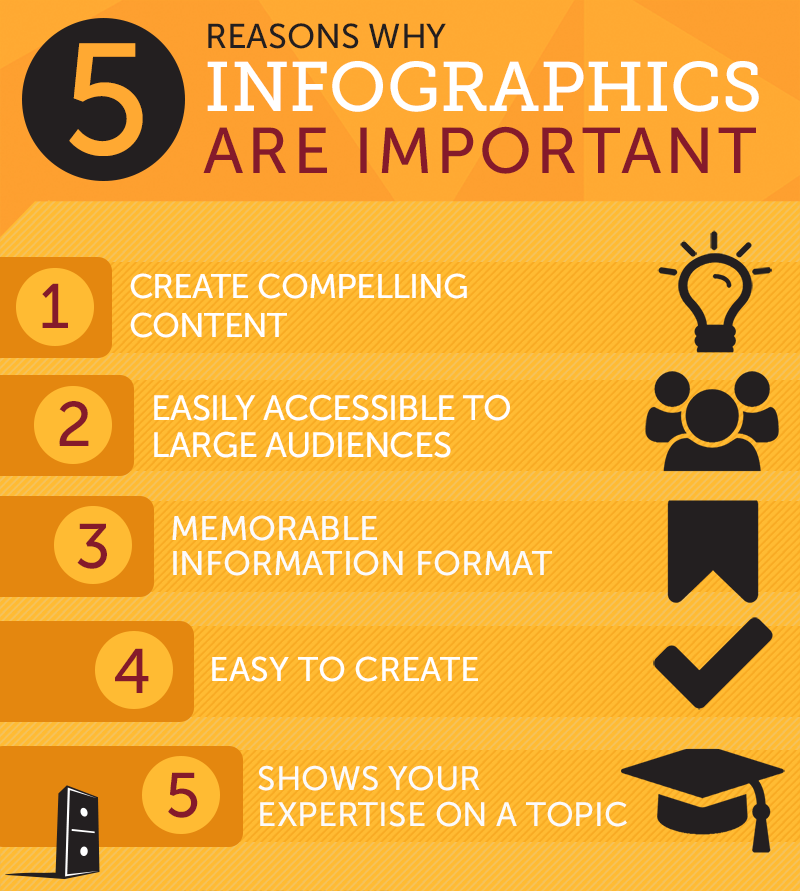 Timeline infographic is important for several reasons:
- Easily digestible: Infographics present complex information in a visually appealing and easy-to-understand manner. By using images, charts, and graphs, information can be quickly and easily conveyed to viewers.
- Memorable: Studies have shown that people remember visual information better than text-based information. Infographics are an effective way to communicate important data or key messages that you want your audience to remember.
- Increased engagement: Infographics are eye-catching and engaging, making them more likely to be shared and liked on social media. This can increase your reach and help you to connect with new audiences.
- Builds brand awareness: Creating and sharing high-quality infographics can help to establish your brand as an authority in your industry. Infographics are often shared and republished by other websites and media outlets, which can help to increase your exposure and brand recognition.
- Saves time: Infographics can be used to quickly communicate important information without requiring the viewer to read through a lot of text. This can save time and help to improve the overall user experience.
Overall, infographics are a powerful tool for communicating complex information in a way that is easily understood and memorable, which can help to increase engagement, build brand awareness, and save time.
Are infographics good for seo
 Infographs can be good for SEO if they are designed and executed properly. Infographics have the potential to generate backlinks and social shares, which can improve a website’s search engine rankings.
When creating infographsfor SEO, it’s important to keep the following best practices in mind:
- Relevant and Engaging Content: The infographic must be relevant to the website’s niche and provide engaging content to the audience.
- Visual Appeal: The design of the infographic should be visually appealing, easy to read, and incorporate appropriate branding and images.
- Shareability: The infographs should be easy to share on social media platforms and include embed codes for easy sharing on other websites.
- Optimization: The infographs should be optimized for search engines by including relevant keywords in the title, meta description, and alt tags.
- Promotion: The infographic should be promoted through social media, email newsletters, and outreach to relevant websites to encourage sharing and linking.
Overall, infographic examples can be a valuable tool for SEO when done correctly. They have the potential to attract backlinks and social shares, which can improve a website’s search engine rankings.
Frequently Asked Questions (FAQs)
What Makes a Good Infograph?
Crafting an effective Infograph involves clarity, relevance, and visual appeal. Ensure your Infograph communicates the message effortlessly, keeping the audience engaged.
Can Infographs Be Animated?
Yes, Infographs can be animated for dynamic storytelling. Animation adds an extra layer of engagement, making your content stand out.
Are There Free Tools for Creating Infographs?
Absolutely! Numerous online platforms offer free and user-friendly tools for crafting basic yet impactful Infographs. Explore options like Canva and Piktochart.
How Can Infographs Enhance Website Content?
Infographs break the monotony of text-heavy content, providing a visual respite. They enhance user engagement, improve understanding, and contribute to a memorable online experience.
Do Infographs Have a Global Appeal?
Yes, the visual nature of Infographs makes them universally understandable, transcending language barriers. They resonate with diverse audiences, making them a global communication tool.
Are There Guidelines for Infograph Color Schemes?
While there are no strict rules, it’s advisable to choose colors that align with your brand or message. Ensure readability and accessibility for a wider audience.
Conclusion
In the ever-evolving landscape of digital communication, Infographs stand as pillars of clarity and engagement. Whether you’re a marketer, educator, or content creator, embracing the power of Infographs opens doors to unparalleled storytelling. Elevate your content, captivate your audience, and embrace the visual revolution with Infographs.